1920 × 1080 · Landscape
 Index › Charts › Statistical
3 chart types
Index › Charts › Statistical
3 chart types
Charts · Statistical
The shape of distribution.
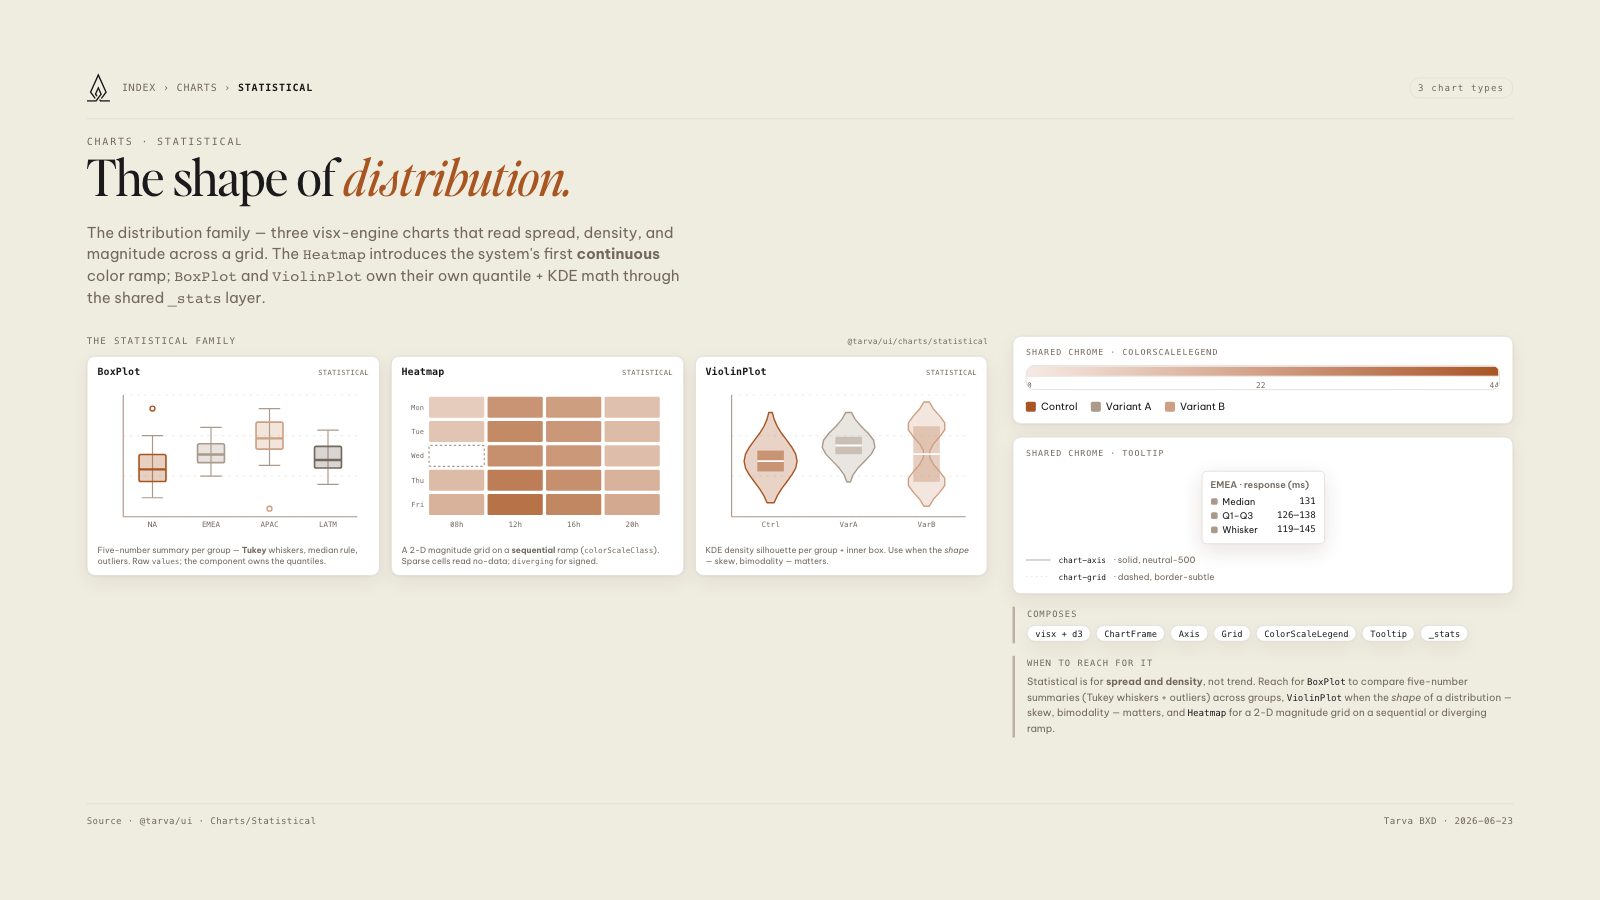
The distribution family — three visx-engine charts that read spread, density, and magnitude across a grid. The Heatmap introduces the system's first continuous color ramp; BoxPlot and ViolinPlot own their own quantile + KDE math through the shared _stats layer.
The Statistical family@tarva/ui/charts/statistical
BoxPlotstatistical
Five-number summary per group — Tukey whiskers, median rule, outliers. Raw
values; the component owns the quantiles.Heatmapstatistical
A 2-D magnitude grid on a sequential ramp (
colorScaleClass). Sparse cells read no-data; diverging for signed.ViolinPlotstatistical
KDE density silhouette per group + inner box. Use when the shape — skew, bimodality — matters.
Shared chrome · ColorScaleLegend
02244
Control
Variant A
Variant B
Shared chrome · Tooltip
EMEA · response (ms)
| Median | 131 |
| Q1–Q3 | 126–138 |
| Whisker | 119–145 |
chart-axis · solid, neutral-500chart-grid · dashed, border-subtle
Composes
visx + d3
ChartFrame
Axis
Grid
ColorScaleLegend
Tooltip
_stats
When to reach for it
Statistical is for spread and density, not trend. Reach for BoxPlot to compare five-number summaries (Tukey whiskers + outliers) across groups, ViolinPlot when the shape of a distribution — skew, bimodality — matters, and Heatmap for a 2-D magnitude grid on a sequential or diverging ramp.
8.5 × 11 · Portrait