1920 × 1080 · Landscape
 Index › Charts › Cartesian
8 chart types
Index › Charts › Cartesian
8 chart types
Charts · Cartesian
Time and category, plotted.
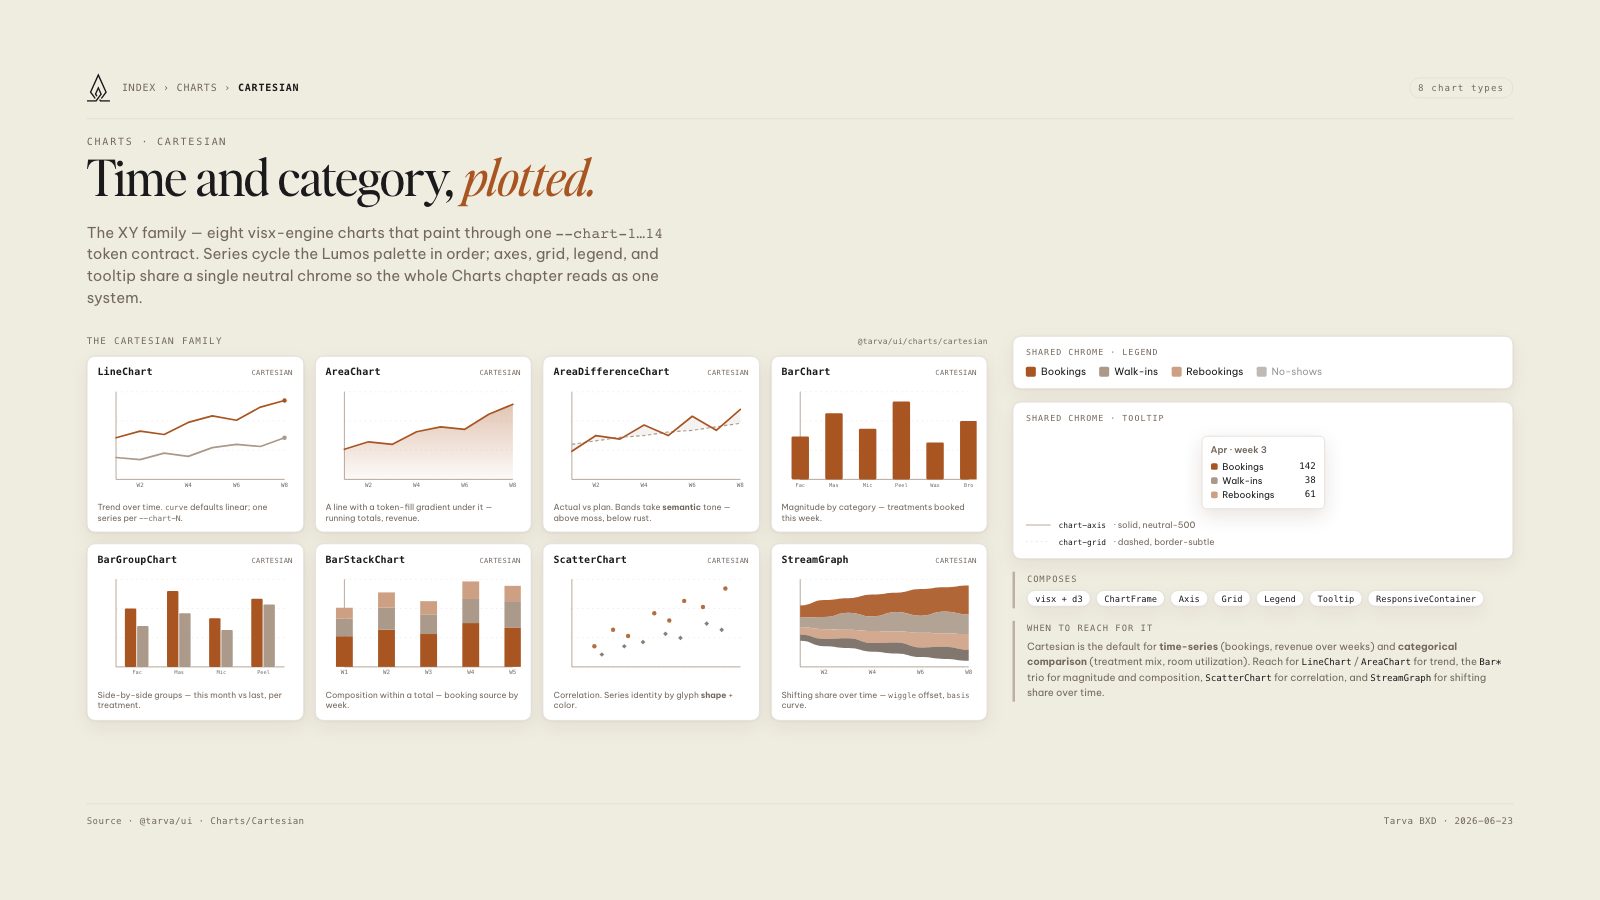
The XY family — eight visx-engine charts that paint through one --chart-1…14 token contract. Series cycle the Lumos palette in order; axes, grid, legend, and tooltip share a single neutral chrome so the whole Charts chapter reads as one system.
The Cartesian family@tarva/ui/charts/cartesian
LineChartcartesian
Trend over time.
curve defaults linear; one series per --chart-N.AreaChartcartesian
A line with a token-fill gradient under it — running totals, revenue.
AreaDifferenceChartcartesian
Actual vs plan. Bands take semantic tone — above moss, below rust.
BarChartcartesian
Magnitude by category — treatments booked this week.
BarGroupChartcartesian
Side-by-side groups — this month vs last, per treatment.
BarStackChartcartesian
Composition within a total — booking source by week.
ScatterChartcartesian
Correlation. Series identity by glyph shape + color.
StreamGraphcartesian
Shifting share over time —
wiggle offset, basis curve.
Shared chrome · Legend
Bookings
Walk-ins
Rebookings
No-shows
Shared chrome · Tooltip
Apr · week 3
| Bookings | 142 |
| Walk-ins | 38 |
| Rebookings | 61 |
chart-axis · solid, neutral-500chart-grid · dashed, border-subtle
Composes
visx + d3
ChartFrame
Axis
Grid
Legend
Tooltip
ResponsiveContainer
When to reach for it
Cartesian is the default for time-series (bookings, revenue over weeks) and categorical comparison (treatment mix, room utilization). Reach for LineChart / AreaChart for trend, the Bar* trio for magnitude and composition, ScatterChart for correlation, and StreamGraph for shifting share over time.
8.5 × 11 · Portrait